|
W-test: dataset adaptive association test for main and
interaction effects in GWAS data |
|
||
|
|
|||
|
Guide - C++ - Linux |
The Method The W-test is designed to test the distributional
differences in cases and controls for categorical variable set, which can be
a single SNP, SNP-SNP, or SNP-Environment pairs. It takes a combined log of
odds ratio form, calculated from the contingency table of the variable set.
The test inherits a chi-squared distribution with data-set adaptive degrees
of freedom f, which is estimated from smaller bootstrapped samples of the
data. The flexible and data-corrected probability distribution allows W-test
to give more accurate p-values, and produce good power while controlling type
I error rates. The calculation speed is very fast, and can perform
genome-wide epistasis testing in about 2 hours, including the bootstrap time.
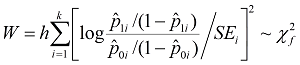
The test
statistic takes the following form:
Where p1i is cell i's
subject proportion in the case group, and p0i is the proportion in
the control group. K is the number of categorical combinations. SE is the
standard error of the log of odds ratio. For details of the expression,
please refer to our paper (Wang, Sun et al. 2016). h and f h and f are the parameters
estimated using bootstrapped samples. N is the total number of samples, and P
is total number variables. The suggested setting is bootstrap times B >
200, subjects number NB= min (1000, N), and number of pairs PB=
min (1000, P). Empirical studies give h �� (k − 1)/k and f �� k − 1.
Convergence simulations can be found here. Application note 1.
The power of W-test is greatest when the number of categorical combinations
is in between 4 to 9 from simulation studies. When k is small, like 2 or 3,
the dependency among the odds ratio is very high, and the power of W will
only be slightly higher than the chi-squared test and logistic regression
(see simulation studies here). When k is large
and sample size is affordable, the dependency is moderate to low, and the h and
f estimates will get very close to default values of h �� (k − 1)/k and f �� k
�C 1. 2.
For each dataset, first estimate h and f, then calculate the pairwise or main
effect using the estimates. The default h and f can be used in the exploration
step, without changing too much of the ranking of the returned pairs. One set
of h and f is needed for each data set. If a sub-population is drawn, the
genetic structure will be changed, and the parameters need to be estimated
again. In
the R package, we provide diagnostic plots for the probability distribution
under null hypothesis for each k. 3. For very large statistics value,
the corresponding p-value of a gamma statistic can be slightly different in R
environment, Excel and C++ software. We recommend using the R returned
p-value as a standard. Updates 4 Aug 2017 �C Howey and Cordell published a follow-up paper on the
W-test [4]: In this paper, Howey and Cordell further investigated the theoretical
properties of the W-test, and applied the method in additional simulation and
real data sets. The authors especially compared the method to the logistic
regression with 8 degrees of freedom. Their simulation studies showed that
the W-test has good/conservative type I error rates and better power than the
Chi-squared test and Logistic regression under certain scenarios. The paper
concluded that the W-test was a useful and practical methods in real GWAS
data analysis, especially for low frequency and rare variants. Howey and Cordell pointed out a data
quality control problem in the original paper, and raised concerned about the
reported real bio-markers. Dr.
Cordell has kindly provided us with the list of exclusion SNPs with high
genotyping errors, by which we have re-done the real data analysis part by
excluding them. The W-test manuscript real data part is therefore revised
accordingly: PDF (with revised real data analysis part �C 4
Aug 2017), Supplementary
Materials (4 Aug 2017). 1. Maggie Haitian Wang, Rui Sun (Co-first
authors), Junfeng Guo, Haoyi Weng, Jack Lee, Inchi Hu, Pak Sham and Benny Chung-Ying Zee (2016). A fast and powerful W-test for
pairwise epistasis testing. Nucleic
Acids Research. doi:10.1093/nar/gkw347. PDF (with revised
real data analysis part �C 4 Aug 2017), Supplementary
Materials (4 Aug 2017). 2. Rui Sun, Haoyi Weng (Co-first), Inchi Hu, Junfeng Guo, William K.K. Wu, Benny Chung-Ying Zee, Maggie
Haitian Wang* (2016) A W-test collapsing method for rare variant association
testing in exome sequencing data. Genetic Epidemiology. 3. Rui Sun,
Maggie Haitian Wang. R package: wtest function for
main and epistasis effect evaluation. arXiv preprint arXiv:1610.03182 4. Howey R and Cordell HJ. Further
investigations of the W-test for pairwise epistasis testing, Wellcome Open Res 2017, 2:54 (doi:
10.12688/wellcomeopenres.11926.1)
|
|
|
|||
|
|
||
|
Copyright |
||